Human Resources Management and Contract Performance Analysis Project
Introduction
This project was developed with the purpose of providing a 360-degree view of a fictitious organization’s workforce composition and contract performance, with a special focus on identifying and managing high-value contracts and their criticality. The dashboard aims to empower managers with crucial information for strategic decision-making in personnel allocation, financial risk management, and operations optimization.
Project Structure
The main requirements and indicators developed for this analysis were:
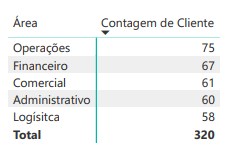
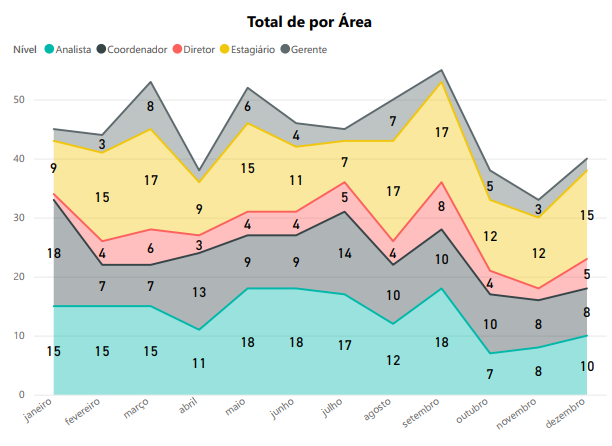
- Workforce Composition: Detail the total number of employees and their distribution by area (Operations, Finance, Commercial, Administrative, and Logistics) and by hierarchical level (Analyst, Coordinator, Manager, Director, Intern).
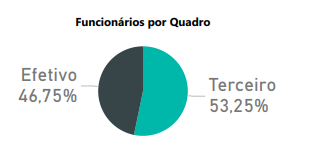
- Employee Roster: Present the proportion between permanent and outsourced employees, a key indicator for understanding the flexibility and cost structure of the team.
- Financial Performance: Display the total value of contracts and the total salary of employees, offering an overview of financial health and personnel costs.
- Contract Analysis by Area and Criticality: Provide a detailed segmentation of the total contract value and the average ticket per service, categorizing them by area and by a criticality status (Normal, Very Critical, Slightly Critical). This is a crucial point for identifying where the largest values are concentrated and which contracts require priority attention.
- Key Client Identification: Highlight clients with the highest contract value, allowing for more targeted relationship management.
Technologies Used
For the construction of this dashboard, the main technology employed was Power BI Desktop.
Given the project’s scope and the information provided, the prototyping phase may have been directly integrated into the development process in Power BI, with rapid iterations and design adjustments made within the tool itself to optimize the user experience.
ETL Process (Extraction, Transformation, and Loading)
The ETL process for this dashboard involved the following steps:
- Extraction: Data was extracted from its original sources, which would typically include HR systems for employee information, and contract management or ERP systems for financial and contract data. The databases were provided in Excel, being imported into the Power BI environment.
- Transformation: In Power Query, an integral part of Power BI, the necessary transformations were applied. This included data cleaning (duplicate removal, null value handling), format standardization, and the creation of new columns or calculated metrics (such as average ticket) to enrich the analysis. Data modeling was performed to establish relationships between employee, contract, and area tables, ensuring the integrity and correct aggregation of information.
- Loading: After transformations and modeling, the data was loaded into the Power BI data model, ready for the creation of visuals and dashboard interactivity.
Dashboard
The dashboard presents a clear and organized interface, with multiple visuals that complement each other to offer a complete analysis. Highlights include bar charts illustrating the distribution of employees and contract values by area, a donut chart for employee roster composition, and detailed tables showing contract criticality. The visuals are designed to be interactive, allowing the user to explore data by different dimensions and filter information as needed. The use of colors and layouts is designed to facilitate quick reading and understanding of key indicators.
Insights
In-depth analysis of the dashboard data revealed valuable insights into the company’s HR and contract management:
Balanced Employee Distribution: The company demonstrates a well-distributed workforce among its operational areas. “Operations: 75”, “Finance: 67”, “Commercial: 61”, “Administrative: 60”, “Logistics: 58”. With a total of 320 employees, the Operations area leads with 75 employees, closely followed by Finance and Commercial. This distribution indicates a solid base for the company’s essential activities.
Regarding levels, there is an interesting balance: “Analyst (75)”, “Intern (69)”, “Coordinator (67)”, “Manager (65)”, and “Director (62)”. The high number of Analysts and Interns suggests a focus on execution and development of new talents, while the robust presence of Coordinators, Managers, and Directors ensures supervision and strategic direction.
Predominance of Outsourced Employees: A particularly notable insight is the composition of the workforce. “Permanent 46.75%”, “Outsourced 53.25%”. More than half of the workforce (53.25%) consists of outsourced employees. This strategy can provide great operational flexibility and cost optimization, allowing the company to scale its operations more agilely according to demand. However, it also highlights the need for rigorous management of contracts with service providers and continuous monitoring of quality and compliance.
High Contract Values in Key Areas: The company’s total contract value is substantial, totaling R$ 80,424,000.

The Operations and Finance areas are those that generate the highest values.
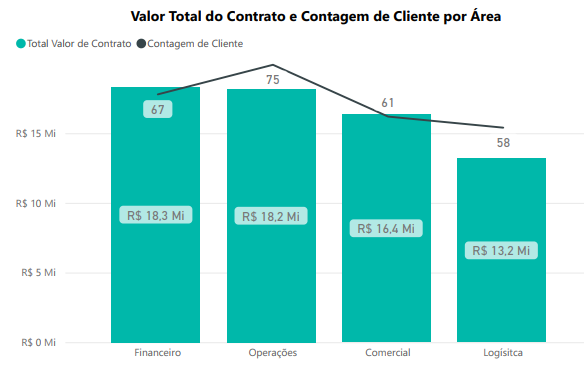
This data, combined with employee distribution, suggests that the areas with the highest contract volume also have the largest number of employees, which is an expected alignment.
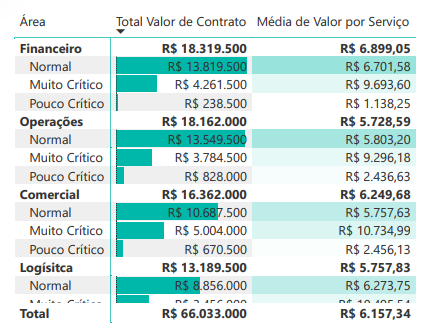
“Very Critical” Contracts with High Average Value: One of the most critical and actionable insights revealed by the dashboard is the relationship between criticality and the average value of contracts.
In the columns “Total Contract Value and Average Service Value”, it is observed that, for all areas (Finance, Operations, Commercial, and Logistics), contracts classified as “Very Critical” consistently show a significantly higher average service value than “Normal” or “Slightly Critical” contracts.
Examples: In Finance, the average value for “Very Critical” is R$9,693.60, compared to R$6,701.58 for “Normal”. In Commercial, “Very Critical” reaches R$10,734.99.
This indicates that the largest and most financially impactful contracts are, paradoxically, those that most frequently face serious problems or challenges. This is vital information for resource planning and for prioritizing interventions.
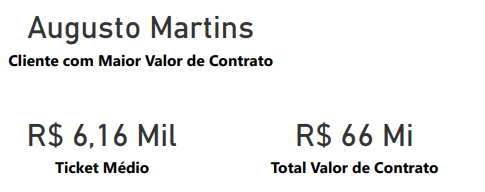
Identification of the Client with the Highest Impact: It is quickly possible to visualize “Augusto Martins” as the “Client with the Highest Contract Value”. This functionality is essential for managing relationships with strategic clients and for allocating VIP service resources. Operational Average Ticket: The average ticket of R$6.16 thousand offers a reference metric for valuing the company’s services or products.
Considerations
The dashboard analysis suggests several strategic considerations for the organization:
Risk Management in High-Value Contracts: The correlation between criticality and high contract value is a warning sign. It is fundamental for the company to establish robust risk management protocols and allocate specialized teams to monitor and mitigate problems associated with these “Very Critical” contracts. This may involve reviewing SLAs, contingency plans, and proactive communication with involved clients. O ptimization of Outsourced Workforce: The high proportion of outsourced employees offers agility but can also imply challenges in cultural integration, maintenance of internal knowledge, and quality control. It is important to ensure that the hiring and management processes for these partners are efficient and that their performance is continuously monitored to ensure the expected delivery.
Resource Allocation: Based on employee distribution and contract criticality, the company can optimize the allocation of its most experienced talents to the areas and contracts that demand greater attention, ensuring that the right resources are in the right places to maximize value and minimize risks.
Strategic Focus on Key Clients: Identifying the client with the highest contract value (Augusto Martins) allows the company to develop personalized retention and expansion strategies for its most valuable clients, strengthening partnerships and ensuring revenue continuity.
Conclusion
The dashboard was a high-impact analytical tool, capable of transforming raw data into actionable intelligence for human resources management and the company’s financial performance. Its main contribution lies in its ability to:
- Provide a clear view of the organizational structure and talent distribution.
- Highlight the flexible workforce composition through the proportion of permanent and outsourced employees.
And, crucially, identify and contextualize the risk associated with higher-value contracts by correlating their criticality with their financial impact.
This project demonstrates the ability to translate data complexities into clear and practical insights, empowering leaders to make more informed decisions about people management, mitigating risks in strategic contracts, and ultimately improving the organization’s profitability and operational efficiency. Its implementation would be a significant step for any company seeking data-driven HR and contract management.